
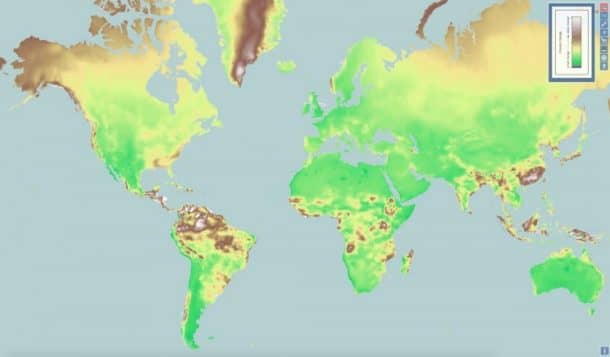
A new interactive map shows that when it comes to climate change, the world is more connected than ever before. Researchers from the University of Cincinnati started the ClimateEx map project that tells the users about an area’s climate history. It can take a city and find a climate twin anywhere on the map.
Geography professor Tomasz Stepinski and his team had to gather more than 50 years worth of meteorological data to make the map. They consulted 50,000 international weather databases from all over the world. “The map demonstrates climate change over time but also climate diversity. The concept is powerful and can inspire a lot of research,” Stepinski said.
The professor is a huge fan of statistics and he’s long been a fan of climate research and wanted to combine both his passions. Stepinski is originally from Poland and spent a large part of his career looking for how statistics could be represented visually. “I’ve lived in Houston, Tucson, and Cincinnati. Climatically speaking, they couldn’t be farther apart,” he said.
Pawel Netzel is another Polish researcher and the joined forces to develop the visual way for climatologists and other scientists to study patterns and compare climates over time in all locations in the world. The ClimateEx project also shows which parts have been hit by global warming the worst.
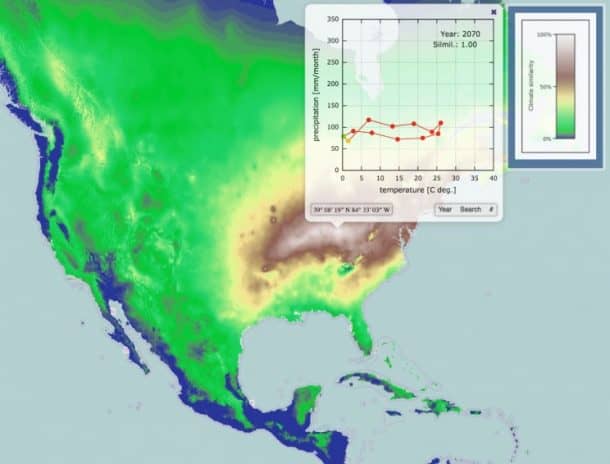
“When people think about climate change, they think about temperature: global warming,” he said. “But climate has many components, including precipitation. People often consider temperature and precipitation separately. But our mathematical model includes both.”
Netzel said that this map can be used for more than just climate research and is a fun tool for people looking for their ideal climates around the world. “ClimateEx is mostly an educational tool,” Netzel said. “Using ClimateEx, it is easy to get answers to questions such as where in the world do we have a climate similar to Houston’s? Where can I find a place with a climate as pleasant as Florida’s?”
People can also find places that have a greater chance of being affected by hurricanes and the likes of such. “ClimateEx enables an easy search for locations where climate change may lead to the occurrence of such extreme phenomena in the future,” he said. “The user simply indicates the location where tornadoes are presently frequent and ClimateEx finds all locations where in 50 years the climate will be conducive to tornadoes.”
Netzel also went on to say what the map will be perfect for. “It can support strategic, long-term planning and decision-making on the future development of urbanized space. It helps to prepare for emerging threats such as increasing the frequency or appearance of extreme weather phenomena. Knowledge about the possibility of hazards will give city planners time to prepare appropriate response plans.”
For people who don’t take climate change seriously and pay no attention to global warming, Stepinski said, “If you were looking at climate change at a scale of a million years, you wouldn’t worry too much. But if you see dramatic changes on the order of a few decades, it’s a big problem. Personally, I’m not happy there are people who seem to disregard this as not much of a problem. It is a problem.”
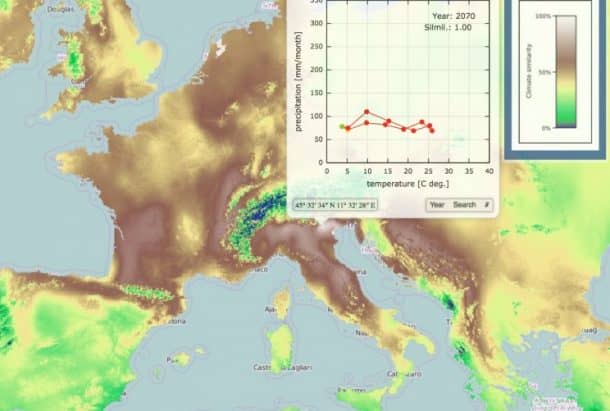
Having lived in Cincinnati, Stepinski found its climate twin and it was discovered to be Vicenza, Italy. “You will see that both Cincinnati’s and Vicenza’s climates have a similar progression of weather conditions throughout the year,” he said. “So a person would experience the passing of the seasons in the same way in both places.”
This really does sound like a major breakthrough. Having a map that lets you compare the climate and weather all around the world seems like a handy tool to have.

is There a LINK to This map??? somewhere??? or did it blow away already???