
Air pollution measurement is a tricky practice since it relies on using fixed monitors and computer modelling and extrapolating data to cover the entire region. But the latest method to measure pollution readings might just do the trick as researchers are now looking to use Google Street View vehicles to fit the air pollution monitors and get highly localized data.
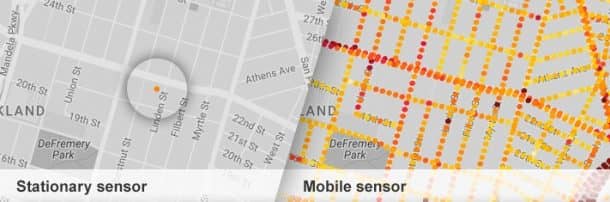
Scientists from the University of Texas (UT) at Austin and the Environmental Defense Fund, Aclima have gathered together to use Google’s Street View cars for measuring air pollution in Oakland, California. They have fixed air pollution sensors on these vehicles and track the air quality in the 78-square-mile (202 km sq) region instead of using the usual three stationary monitors.
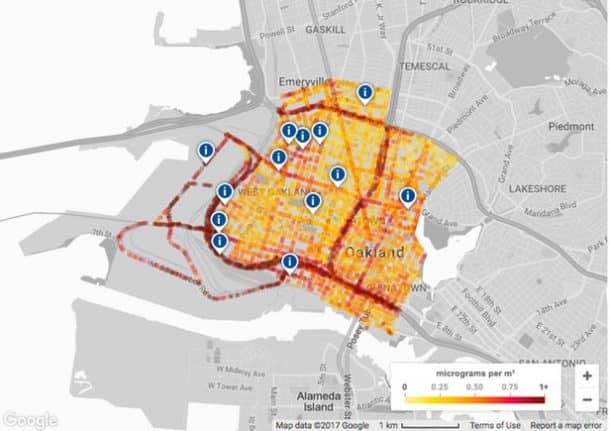
Already the Google Street View vehicles have driven more than 14,000 miles (22,500 km) while gathering more than three million unique measurements at different times of the day, week and year across 2015 and 2016. These spatially precise datasets of air pollution were collated and turned into an interactive map which can be seen just as any other Google map.
The map indicates hotspots of different kinds of pollutants and also offers explanations and suggestions on the reasons behind the mess using the information collected from local community leaders.
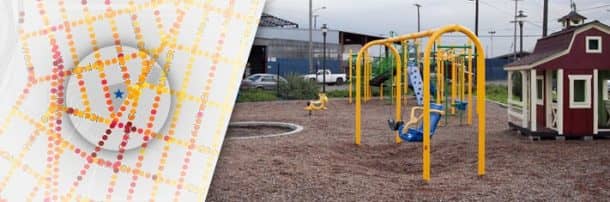
For example, high levels of nitric oxide were associated with heavy traffic along the city’s freeways. Other major sources of pollution included heavy duty trucks and industrial activities, with one particular hotspot being the cause of most concern since it is located near homes and a children’s playground.
“The new mobile technology allows us to measure air pollution levels where people actually breathe the air – at street level,” said Joshua Apte, assistant professor in the Department of Civil, Architectural & Environmental Engineering at UT Austin, and lead author of the study.
“By allowing us to understand how air pollution varies between and even within city blocks, this technique will help policymakers and the public make smarter choices about how to reduce pollution and improve public health.”
You can view the interactive maps online here.
